Weekly Challenge 49: Get in Line
1. A cup of tea is made and the temperature measured in degrees
Celsius every second. What would the temperature-time graph look
like?
$$y=\frac{A}{2^t}+B$$
y = temp, t = time 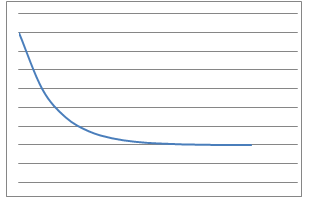
2. The pendulum of a grandfather clock swings to and fro and the
angle of the bob from the vertical is measured every 100th of a
second. What would the angle-time graphs look like?
$$y = A \sin(Bt)$$ 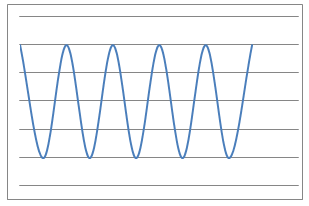
y = angle, t = time
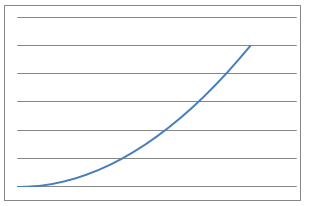
3. I throw a tennis ball straight up into the air and catch it. The
height of the ball from the ground is measured over the time of the
journey using freeze-frame photography. What would the height-time
graph look like?
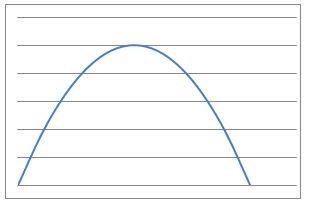
$$y=Ax^2$$
y = height, x = time
4. I measure several objects using inches and then using metres.
What would the inches-metres graph look like?
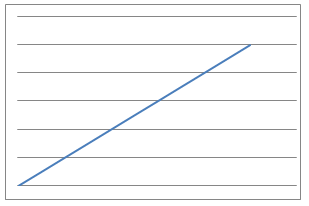
$$y = Ax$$
y = inches, x = metres
5. I jump out of a plane and the distance fallen from the plane is
measured every $0.1$ second until I open my parachute. What would
the distance-time graph look like whilst in freefall?
$$y = A x(x-B) + C$$
y = distance, x = time
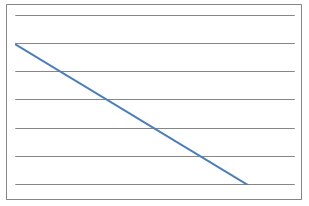
6. I drive at 70 miles an hour along the motorway and note the
reading on my mileometer every 5 minutes. What would the plot of
mileometer v minutes passes graph look like?
$$y = Ax+B$$
y = milometer, x = minutes
7. I bring two magnets of the same polarity together directly in a
line in a sequence of steps. Starting from 1 metre, I halve the
remaining distance each time and measure the force felt between the
magnets. What would the force-distance graph look like?
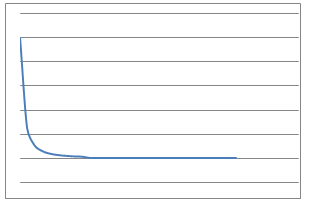
$$ y=\frac{A}{x}$$
y = distance, x = force
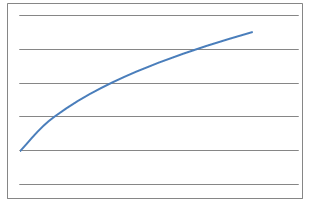
8. I blow up a roughly spherical balloon using a balloon pump.
After each pump I measure the radius of the balloon in centimetres.
What would the number-of-pumps vs radius graph look like?
$$y=A r^3$$
y = no. of pumps, r = radius
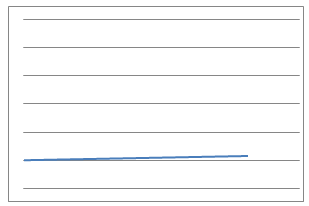
9. I suck water through a straw out of a large beaker at a constant
rate and measure the volume of liquid remaining at various times.
What would the volume-time graph look like?
$$y = Ax + B$$
y = volume, x = time