In the following tables we provide the numerical answers to the first four questions associated with each picture. The remaining last question is randomly generated by the program, so below we give an outline of the strategy one needs to follow to tackle it.
In general, it is important to take more than one measurements of each quantity, in order to improve accuracy. Questions 1 and 2 in each problem are about making a few measurements on the picture, and question 3 involves making a simple computation using these measurements. Questions 4 and 5 are not related to the image, and only require an accurate measurement of the scale bar and then some calculations about the scale of the picture.
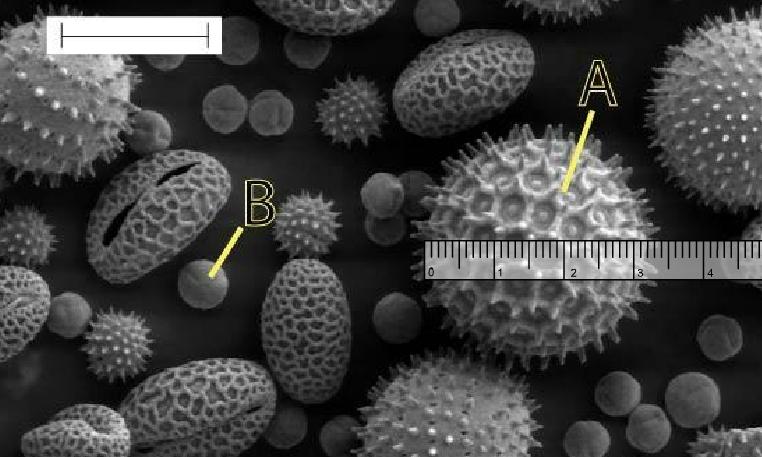
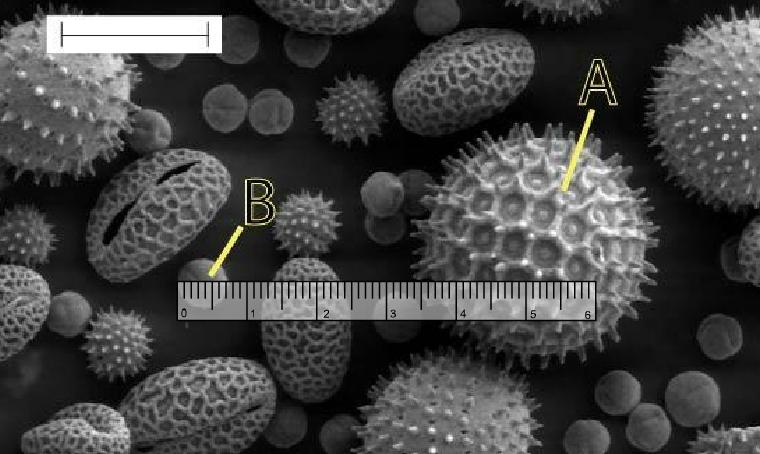
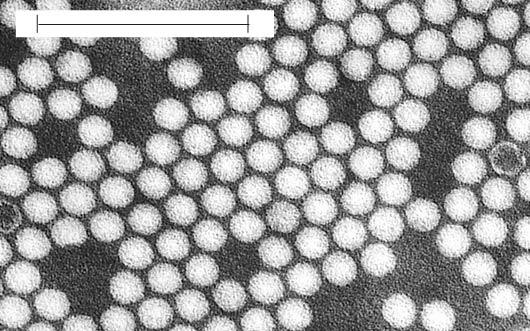
As an example, we will solve the fifth set of questions, which are about the Pollen. Initially we measure the scale bar to find it has a length of 2.1 units.
Question 1
We find that the diameter of the particle A is 3.2 units, so we take that the radius we require is 1.6 units. To convert this into meters, we compare it with the scale bar, and so we see that the radius is
$$ r_A = \frac{1.6}{2.1} \times 0.00006 \approx 4.57 \times 10^{-5} $$
This gives us a percent error of 1.7 which is an excellent estimate. Now, with some trial and error, we find that the most accurate value we can get is $ 4.5 \times 10^{-5}$.
Question 2
The diameter of particle B is 0.7 units, and since this is exactly 1 third of the scale bar, we immediately conclude that particle B has a diameter of 0.00002 and hence a radius of 0.00001 meters. Trying this value, we get a percent error of 0, so our approximation is exact.
Question 3
First of all, we compare the volume of A to the volume of B. In particular, we get
$$ \frac{V_A}{V_B} = {r_A^3}{r_B^3} \approx 91.13 $$
So, if we assume a packing efficiency of 74%, we expect that approximately $91.13 \times 0.74 \approx 67$ B particles will fit inside a particle A. Our approximation is not absolutely correct, but again a few trials should yield the correct answer, which is 68 particles.
Now, we present the tables with the exact numerical answers to all the questions. At the end we have the strategy for solving the fifth question in each set.
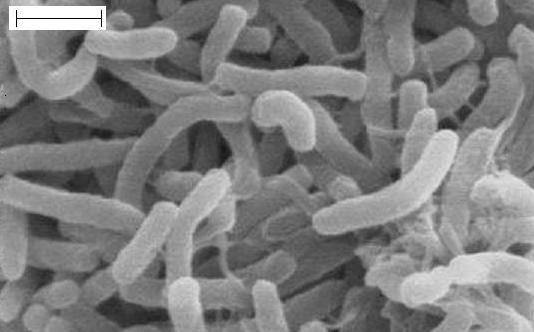
Table 1: Cholera
| 1 | 0.2 |
| 2 | 0.1 |
| 3 | 24 |
| 4 | 17000 |
Table 2: Polio
| 1 | 0.000000009 |
| 2 | 110 $\times$ 10$^6$ |
| 3 | 1 $\times$ 10$^{17}$ |
| 4 | 840000 |
Table 3: Tobacco mosaic virus
| 1 | 0.00000029 |
| 2 | 34000 |
| 3 | 10900000000000000 |
| 4 | 100000 |
Table 4: Mammalian mitochondria
| 1 | 0.00000055 |
| 2 | 1800 |
| 3 | 0.25 |
| 4 | 71000 |
Table 5: Pollen
| 1 |
4.5 $\times$ 10$^{-5}$ |
| 2 | 1 $\times$ 10$^{-5}$ |
| 3 | 68 |
| 4 | 350 |
Table 6: Escherichia Coli
| 1 | 1.6 $\times$ 10$^{-6}$ |
| 2 | 3 $\times$ 10$^{-19}$ |
| 3 | 25 |
| 4 | 16000 |
Table 7: Human chromosomes
| 1 | 2 $\times$ 10$^{-6}$ |
| 2 | 9 $\times$ 10$^{-6}$ |
| 3 | 4.5 $\times$ 10$^7$ |
| 4 | 1600 |
Table 8: Diatom
| 1 | 2.1 $\times$ 10$^{-5}$ |
| 2 | 9 $\times$ 10$^{9}$ |
| 3 | 3000 |
| 4 | 800 |
Table 9: Asterionella formosa
| 1 | 1.6 $\times$ 10$^{-3}$ |
| 2 | 0.09 |
| 3 | 220 |
| 4 | 20 |
Table 10: Drosophila melanogaster
| 1 | 2.5 |
| 2 | 0.06 |
| 3 | 1.1 $\times$ 10$^{-3}$ |
| 4 | 40 |
Table 11: Plagiomnium affine chloroplasts
| 1 | 5.7 $\times$ 10$^{-5}$ |
| 2 | 1.5 $\times$ 10$^{-9}$ |
| 3 | 410000 |
| 4 | 700 |
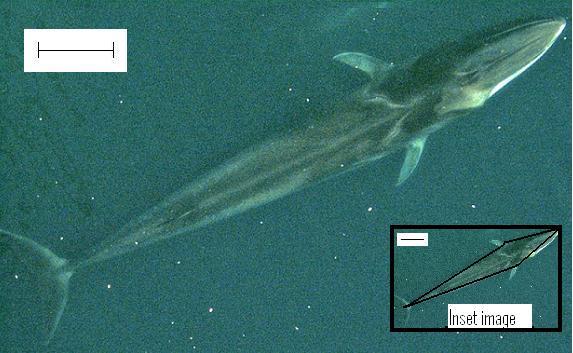
Table 12: Whale
| 1 | 5.7 |
| 2 | 24 |
| 3 | 67 |
| 4 | 5 $\times$ 10$^{-3}$ |
Outline of solution for Question 5:
The ruler measures cm. So, the scale bar represents a length of
$$ L = \frac{\textrm{length in cm}\times 10^{-2}}{\textrm{Magnification}} \textrm{meters} $$
These are the images. They are here for convenience so that they can be edited
Cholera
Whale
Polio